Menu
The Growth Stock Report

Primary Menu

Skip to content
  • About
    • Contact
    • Disclaimer
  • Research
    • Market Bias Flag
    • Stock Labels
    • Sector Trends
  • Market Metrics
    • Industry Groups
    • Hit List
Show Header Sidebar Content

The Growth Stock Report

strategy, money management, discipline

Month: February 2015

WCIC, Target Time

Posted onFebruary 26, 2015February 26, 2015AuthorGSRTrades

A 10%+ move on WCIC the day after buying it puts profit targets in site.  The 20% initial target, where this blogger exits half the position, would be hit at about 24, considering the 20.25 Read More …

CategoriesBreakout Watch

Wicked, WCIC

Posted onFebruary 25, 2015AuthorGSRTrades

Ideal high-vol breakout on WCI Communities (WCIC.).  This blogger is all in after mentioning any break through 20.25 would be an invite. That 20 mark is a big psychological one. Note that’s a weekly chart above. Read More …

CategoriesArchives, Breakout Watch

Bustin’ Loose

Posted onFebruary 21, 2015February 21, 2015AuthorGSRTrades

Take a picture, we’re looking at  perfect breakouts on the major indexes. They don’t happen often. But more importantly, their attractiveness doesn’t really make them any better than any other new high. Gotta like the Read More …

CategoriesThe Breakdown

Train Keeps A Rollin’

Posted onFebruary 19, 2015AuthorGSRTrades

Major market continues higher despite a little pause for the S&P 500. Don’t think. Observe. Longs are working. Be defensive.  

CategoriesThe Breakdown

Positions Update

Posted onFebruary 16, 2015February 16, 2015AuthorGSRTrades

Long TWTR. Bought at 38 and 40. Out at 48 for 20% profit. Thanks. Long USO, March 20 Calls. – Out. Bought at .78. Final Exit at 1.08. Might be too early to call a Read More …

CategoriesPositions Update

Bull On Prowl

Posted onFebruary 15, 2015AuthorGSRTrades

Nice grab bag of fast runners this week. Bull is on the prowl. Screen based on: EPS > 20% Quarterly Sales > 20% Quarterly ROE > 15% Price > 50 and 200 SDMA’s Price > Read More …

CategoriesGrowth Stocks

It’s That Easy

Posted onFebruary 15, 2015AuthorGSRTrades

Broad-based breakout in effect. Waste of time to think. Just watch… watch for signs of buy-vol drying up and/or leadership breaking down. It’s that easy. It is. Bear Bias down. Neutral Bias Up.  

CategoriesArchives, The Breakdown

Post Up

Posted onFebruary 13, 2015AuthorGSRTrades

  The breakout has begun. Let the market do the talking, and we’ll react. Carry on.

CategoriesThe Breakdown

Burn The Burned

Posted onFebruary 12, 2015AuthorGSRTrades

Homebuilders are back. This blogger’s anticipation of an industry wide breakout soured after a couple of less than rosy outlooks from key companies sent investors into defensive mode. That big, fat red volume bar tells Read More …
CategoriesArchives, Breakout Watch, Chart Watch

Slow N’ Low

Posted onFebruary 12, 2015AuthorGSRTrades

The broader market looks to breakout as every major index and key sector trades solidly above the 50 and 200 SMA’s. If you’re short get out. Aggressive money gets in front. Keep it in perspective Read More …

CategoriesThe Breakdown

Cocked, Might Be Loaded

Posted onFebruary 11, 2015February 11, 2015AuthorGSRTrades

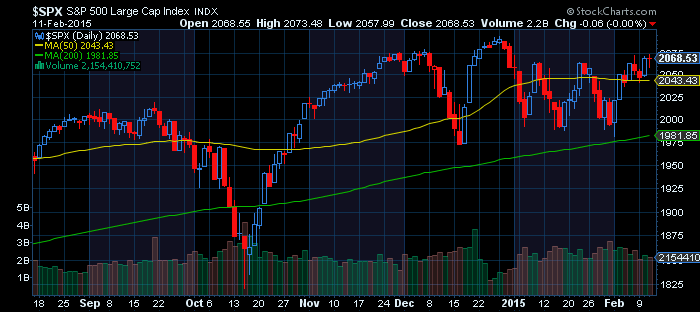
Slight accumulation and we’re looking at a cup with handle position for the majors. Shorts must be nervous about now. This blog has been out on a bear bias, but lost conviction actually short sessions Read More …

CategoriesThe Breakdown

Bull Herd

Posted onFebruary 7, 2015February 7, 2015AuthorGSRTrades

Here’s a collection of bases and pullbacks, as well as a few broken charts and non trending vehicles in this week’s screen for: EPS > 20% Quarterly Sales > 20% Quarterly ROE > 15% Price > 50 Read More …

CategoriesArchives, Growth Stocks

Post navigation

← Older posts

Archives

Market Bias

Caution
Caution
Nasdaq above its 50- and 200-day averages; S&P has 7 distribution days.
As of market close: 10/09/26
(updated 10/10/26 10:14 PM ET)
How the flag works

20-Day Accumulation Distribution Score

  Clear A/D (Days)
SPX 0/7
COMPQ 1/3
Volume: NYSE (SPX), QQQ (COMPQ) (why?)
As of market close: 10/09/26
(updated 10/10/26 3:57 PM ET)

Sector Trends

TickerETFBias
IGViShares Expanded Tech-Software+
QTECFirst Trust NASDAQ-100-Tech Sector ETF+
XLKTechnology Select Sector SPDR ETF+
SMHVanEck Semiconductor ETF+
XLEEnergy Select Sector SPDR ETF+
IBBiShares Biotechnology ETF+
FDNFirst Trust Dow Jones Internet ETF+
XLVHealth Care Select Sector SPDR ETF+
IGEiShares North American Natural Resources+
IYZiShares US Telecommunications
PPHVanEck Pharmaceutical ETF
XLFFinancial Select Sector SPDR ETF
KIESPDR S&P Insurance ETF
KCESPDR S&P Capital Markets ETF
XLPConsumer Staples Select Sector SPDR ETF
OIHVanEck Oil Services ETF
IYTiShares Transportation Average
XRTSPDR S&P Retail ETF
XLIIndustrial Select Sector SPDR ETF
KRESPDR S&P Regional Banking ETF
XLBMaterials Select Sector SPDR ETF
KBESPDR S&P Bank ETF
XLYConsumer Discret Sel Sect SPDR ETF
IHIiShares US Medical Devices
XLUUtilities Select Sector SPDR ETF
XMESPDR S&P Metals and Mining ETF
PPAInvesco Aerospace & Defense ETF
XHBSPDR S&P Homebuilders ETF
+ = Sector above 50-day and 200-day SMA's.
= Sector above 200-day SMA, below 50-day SMA.
+ = Sector above 50-day SMA, below 200-day SMA (improving).
= Sector below 200-day and 50-day SMA's.
As of market close: 10/09/26
Updated 10/10/26 at 4:24 PM ET
How to read this table

Categories

  • Archives
  • Breakout Watch
  • Chart Watch
  • Growth Stocks
  • Hit List
  • Market Bias
  • Positions Update
  • Research
  • Shorts
  • Story Stocks
  • The Breakdown
  • The Growth Stock Report

Archives

Archives

  • October 2026
  • May 2020
  • April 2020
  • March 2017
  • February 2017
  • October 2016
  • September 2016
  • August 2016
  • July 2016
  • June 2016
  • May 2016
  • April 2016
  • March 2016
  • February 2016
  • January 2016
  • November 2015
  • October 2015
  • September 2015
  • August 2015
  • July 2015
  • June 2015
  • May 2015
  • April 2015
  • March 2015
  • February 2015
  • January 2015
  • December 2014
  • November 2014
  • October 2014
  • September 2014
  • August 2014
  • July 2014
  • June 2014
  • May 2014
  • April 2014
  • March 2014
  • February 2014
  • January 2014
  • December 2013
  • November 2013
  • October 2013
  • September 2013
  • August 2013
  • July 2013
  • June 2013
  • May 2013
  • April 2013
  • March 2013
  • February 2013
  • January 2013
  • December 2012
  • November 2012
  • October 2012
  • September 2012
  • July 2012
  • June 2012
  • April 2012
  • March 2012
  • February 2012
  • January 2012
  • October 2011
  • September 2011
  • August 2011
  • July 2011
  • June 2011
  • October 2010
  • September 2010
  • August 2010
  • July 2010
  • June 2010
  • May 2010
  • April 2010
  • March 2010
  • February 2010
  • January 2010
  • November 2009
  • October 2009
  • September 2009
  • August 2009
  • July 2009
  • June 2009
  • May 2009
  • April 2009
  • March 2009
  • February 2009
  • January 2009
  • December 2008
  • November 2008
  • October 2008
  • September 2008
  • August 2008
  • July 2008
  • June 2008
  • May 2008
  • April 2008
  • March 2008
  • February 2008
  • January 2008
  • December 2007
  • November 2007
  • October 2007
  • September 2007
  • August 2007
  • July 2007
  • June 2007
  • May 2007
  • April 2007
  • March 2007
  • February 2007
  • January 2007
  • December 2006
  • November 2006
  • October 2006
  • September 2006
  • August 2006
  • July 2006
  • June 2006
  • May 2006
  • April 2006
  • March 2006
  • February 2006
  • January 2006
  • December 2005
  • November 2005
  • October 2005
  • September 2005
  • August 2005
  • July 2005
  • June 2005
  • May 2005
  • April 2005
  • March 2005
  • February 2005
  • January 2005
Copyright © 2026 The Growth Stock Report. All Rights Reserved.
Clean Box by Catch Themes
Scroll Up
  • About
    • Contact
    • Disclaimer
  • Research
    • Market Bias Flag
    • Stock Labels
    • Sector Trends
  • Market Metrics
    • Industry Groups
    • Hit List