Menu
The Growth Stock Report

Primary Menu

Skip to content
  • About
    • Contact
    • Disclaimer
  • Research
    • Market Bias Flag
    • Stock Labels
    • Sector Trends
  • Market Metrics
    • Industry Groups
    • Hit List
Show Header Sidebar Content

The Growth Stock Report

strategy, money management, discipline

Month: September 2013

Back To Base

Posted onSeptember 26, 2013AuthorGSRTrades

The Dow Industrial Index and S&P 500 appear to be having second thoughts about continuing their breakouts as the Nasdaq entices buyers by holding high. We might expect to see some heavy selling at these Read More …

CategoriesThe Breakdown

Semi’s Won’t Sell

Posted onSeptember 26, 2013AuthorGSRTrades

sox_092613

CategoriesChart Watch

Words And Tricks

Posted onSeptember 24, 2013AuthorGSRTrades

Mere words may move markets, but it’s the underlying patterns that buyers and sellers groove into the market every day, week, month and year that rule our analysis.  Tuesday’s mixed bag of small cap breakouts Read More …

CategoriesThe Breakdown

Russell 2K Breakout

Posted onSeptember 24, 2013AuthorGSRTrades

RUT_osr_092413

CategoriesChart Watch

Acrophobia

Posted onSeptember 20, 2013AuthorGSRTrades

Heavy, institutional grade selling hit the exchanges Friday, making the major indexes look a bit scared in their new high territory. One day means little. But traders take note, it’s these kind of high volume Read More …

CategoriesThe Breakdown

About A Breakout

Posted onSeptember 19, 2013AuthorGSRTrades

The major indexes are holding new highs a day after a solid upside move on high volume. Nasdaq is our technical leader as the Dow and S&P 500 follow after springing from six week bases.  Read More …

CategoriesThe Breakdown

Stud Screen

Posted onSeptember 19, 2013September 19, 2013AuthorGSRTrades

Future top earners are screened for as we look for 30% growth or more in earnings over the next five years, weeding out false promises as we also screen for those with current sales showing Read More …

CategoriesGrowth Stocks

The Bull Knocks

Posted onSeptember 17, 2013AuthorGSRTrades

We’d be foolish to bet against new highs being made in the Dow and S&P 500 in the coming sessions. We’re here at the door once again. Markets usually don’t just turn direction without making Read More …

CategoriesThe Breakdown

Not So Fast

Posted onSeptember 16, 2013AuthorGSRTrades

Happy stocks this morning turned sour into the close as the Nasdaq posted a modest loss on distribution.  The Dow and S&P 500’s retreats from earlier highs weren’t as dramatic. We see it all as Read More …

CategoriesChart Watch, The Breakdown

Top EPS and RS Screen

Posted onSeptember 15, 2013AuthorGSRTrades

Here’s a look at the market’s top EPS and RS stocks, meeting our requirements for the top 20% of each category as well as basic price and market cap standards: Symbol Company Name Price ADVS Read More …

CategoriesGrowth Stocks

Lower Base Watch

Posted onSeptember 13, 2013September 13, 2013AuthorGSRTrades

This screen helps identify the beaten down winners that appear to be catching a breath: Sales and Earnings +30% quarter over quarter, return on equity above 15%, above 50-day moving average and below 200-day moving Read More …
CategoriesGrowth Stocks

Rock Steady

Posted onSeptember 12, 2013September 13, 2013AuthorGSRTrades

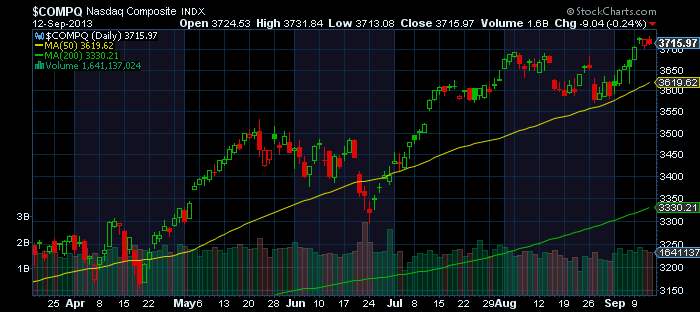
Solid look to this Nasdaq breakout. Take it all in, as a charge to new highs on a major index isn’t an everyday phenom.    Smooth sailing with multiple accumulation days with no heavy selling. Read More …

CategoriesChart Watch, The Breakdown

Post navigation

← Older posts

Archives

Market Bias

Caution
Caution
Nasdaq above its 50- and 200-day averages; S&P has 7 distribution days.
As of market close: 10/09/26
(updated 10/10/26 10:14 PM ET)
How the flag works

20-Day Accumulation Distribution Score

  Clear A/D (Days)
SPX 0/7
COMPQ 1/3
Volume: NYSE (SPX), QQQ (COMPQ) (why?)
As of market close: 10/09/26
(updated 10/10/26 3:57 PM ET)

Sector Trends

TickerETFBias
IGViShares Expanded Tech-Software+
QTECFirst Trust NASDAQ-100-Tech Sector ETF+
XLKTechnology Select Sector SPDR ETF+
SMHVanEck Semiconductor ETF+
XLEEnergy Select Sector SPDR ETF+
IBBiShares Biotechnology ETF+
FDNFirst Trust Dow Jones Internet ETF+
XLVHealth Care Select Sector SPDR ETF+
IGEiShares North American Natural Resources+
IYZiShares US Telecommunications
PPHVanEck Pharmaceutical ETF
XLFFinancial Select Sector SPDR ETF
KIESPDR S&P Insurance ETF
KCESPDR S&P Capital Markets ETF
XLPConsumer Staples Select Sector SPDR ETF
OIHVanEck Oil Services ETF
IYTiShares Transportation Average
XRTSPDR S&P Retail ETF
XLIIndustrial Select Sector SPDR ETF
KRESPDR S&P Regional Banking ETF
XLBMaterials Select Sector SPDR ETF
KBESPDR S&P Bank ETF
XLYConsumer Discret Sel Sect SPDR ETF
IHIiShares US Medical Devices
XLUUtilities Select Sector SPDR ETF
XMESPDR S&P Metals and Mining ETF
PPAInvesco Aerospace & Defense ETF
XHBSPDR S&P Homebuilders ETF
+ = Sector above 50-day and 200-day SMA's.
= Sector above 200-day SMA, below 50-day SMA.
+ = Sector above 50-day SMA, below 200-day SMA (improving).
= Sector below 200-day and 50-day SMA's.
As of market close: 10/09/26
Updated 10/10/26 at 4:24 PM ET
How to read this table

Categories

  • Archives
  • Breakout Watch
  • Chart Watch
  • Growth Stocks
  • Hit List
  • Market Bias
  • Positions Update
  • Research
  • Shorts
  • Story Stocks
  • The Breakdown
  • The Growth Stock Report

Archives

Archives

  • October 2026
  • May 2020
  • April 2020
  • March 2017
  • February 2017
  • October 2016
  • September 2016
  • August 2016
  • July 2016
  • June 2016
  • May 2016
  • April 2016
  • March 2016
  • February 2016
  • January 2016
  • November 2015
  • October 2015
  • September 2015
  • August 2015
  • July 2015
  • June 2015
  • May 2015
  • April 2015
  • March 2015
  • February 2015
  • January 2015
  • December 2014
  • November 2014
  • October 2014
  • September 2014
  • August 2014
  • July 2014
  • June 2014
  • May 2014
  • April 2014
  • March 2014
  • February 2014
  • January 2014
  • December 2013
  • November 2013
  • October 2013
  • September 2013
  • August 2013
  • July 2013
  • June 2013
  • May 2013
  • April 2013
  • March 2013
  • February 2013
  • January 2013
  • December 2012
  • November 2012
  • October 2012
  • September 2012
  • July 2012
  • June 2012
  • April 2012
  • March 2012
  • February 2012
  • January 2012
  • October 2011
  • September 2011
  • August 2011
  • July 2011
  • June 2011
  • October 2010
  • September 2010
  • August 2010
  • July 2010
  • June 2010
  • May 2010
  • April 2010
  • March 2010
  • February 2010
  • January 2010
  • November 2009
  • October 2009
  • September 2009
  • August 2009
  • July 2009
  • June 2009
  • May 2009
  • April 2009
  • March 2009
  • February 2009
  • January 2009
  • December 2008
  • November 2008
  • October 2008
  • September 2008
  • August 2008
  • July 2008
  • June 2008
  • May 2008
  • April 2008
  • March 2008
  • February 2008
  • January 2008
  • December 2007
  • November 2007
  • October 2007
  • September 2007
  • August 2007
  • July 2007
  • June 2007
  • May 2007
  • April 2007
  • March 2007
  • February 2007
  • January 2007
  • December 2006
  • November 2006
  • October 2006
  • September 2006
  • August 2006
  • July 2006
  • June 2006
  • May 2006
  • April 2006
  • March 2006
  • February 2006
  • January 2006
  • December 2005
  • November 2005
  • October 2005
  • September 2005
  • August 2005
  • July 2005
  • June 2005
  • May 2005
  • April 2005
  • March 2005
  • February 2005
  • January 2005
Copyright © 2026 The Growth Stock Report. All Rights Reserved.
Clean Box by Catch Themes
Scroll Up
  • About
    • Contact
    • Disclaimer
  • Research
    • Market Bias Flag
    • Stock Labels
    • Sector Trends
  • Market Metrics
    • Industry Groups
    • Hit List