As long as uncertainty prevails over Europe’s solvency issues we’ll expect to see more volatility.
We’re maintaining our Sell Bias on stocks for lack of better technicals. Multiple Distribution Days, where sell-volume has out-paced buyers, has been been a consistent warning for the better part of a month now.
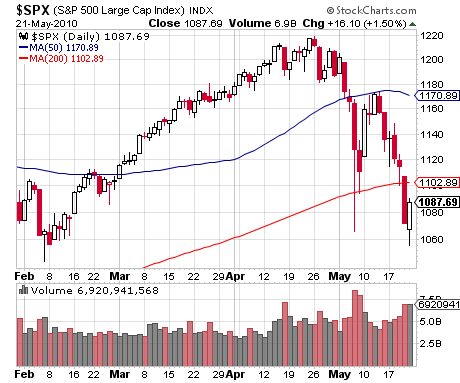
What was hoped by Bulls to be a trendline bounce during the “flash crash” two weeks ago is now being tested as the Dow and S&P 500 close below their 40-week moving averages for the first time in nearly a year.
Not one single stock sector posted a gain last week as the number of them trading under their major averages increased to about half.
The rapid deterioration has many speculators, including ourselves, on the lookout for a bounce of some sort from these levels, as corrections are notorious for.
Of particular interest are financial stocks (XLF), and most notably the Broker Dealers (IAI), which helped spur a broad market rally Friday after the finalization to Congress’s financial industry reform.
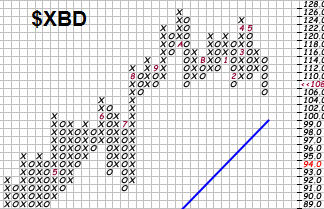
Whether or not the sector has what it takes to lead anything sustainable remains to be seen. The Broker Dealer Index ($XBD) shows a significant breakdown on its point-and-figure chart, which illustrates a significant move by filtering out the noise of random price-action.
Relative strength from the Nasdaq 100 (QQQQ), S&P 400 midcaps (MDY) and Russell 2000 small caps (IWM), which unlike their parent indexes are all trading above their 40-day moving averages, also gives Bulls some evidence that not all is completely broken in their trend.
Similar resilience from Transportation (IYT), Semiconductors (SMH) and Retail (XRT), key components of sustainable broad market trends, are also encouraging.
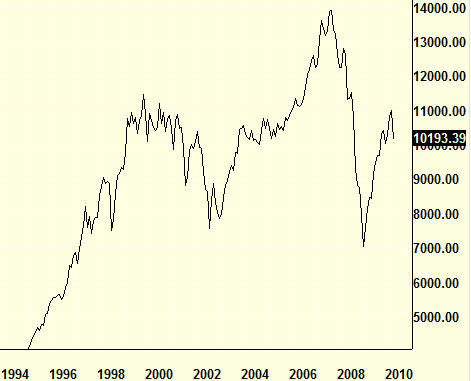
Bounce or not, the prospects of more selling look most striking in a 15-year monthly chart of the Dow where the right side of a bearish head-and-shoulder pattern may be forming.
It’s never been our goal to predict the long-term trends. What we want is to correctly identify friendly or unfriendly conditions to buy or sell our beloved Growth Stocks.
While our overall bias prevents us from buying, there are still a number of solid looking companies poised to breakout of technical bases. No telling if they’ll get the bids needed or not.
Last week a clear flight to safety was seen with higher bids for Treasury bonds, one of the few gainers, as well as Barclay’s Aggregate Bond Index (AGG), which hit a new high.
Technically Speaking
Major Indexes – ETFs
|
Bias
|
Symbol
|
ETF
|
1-Week
|
4-Weeks
|
|
|
TLH
|
iShares Barclays 10 Year Treasury (9.4yr) |
2%
|
6%
|
|
|
AGG
|
iShares Barclays Aggregate Bond (4.3yr) |
1%
|
2%
|
|
|
BWX
|
SPDR Barcap Global Ex-U.S. Bond (6.5yr) |
1%
|
-3%
|
|
|
BSV
|
Vanguard Short-Tm Bond Mix (2.6yr) |
0%
|
1%
|
|
|
LQD
|
iShares iBoxx Invest Grade Bond (7.1yr) |
0%
|
0%
|
|
|
SHY
|
Barclays Low Duration Treasury ETF (1.9yr) |
0%
|
1%
|
|
|
SHV
|
Barclays Short-Term Treasury (0.4) |
0%
|
0%
|
|
|
EMB
|
iShares JPM Emerg Markets Bond (7.0yr) |
-2%
|
-3%
|
|
|
TIP
|
iShares Barclays TIPS (6.0yr) |
0%
|
2%
|
|
|
DBA
|
DB Agricultural Commodities Index |
0%
|
-4%
|
|
|
HYG
|
iBoxx $ High Yield Corporate Bond (4.2yr) |
-2%
|
-5%
|
|
|
IEV
|
iShares S&P Europe 350 Index Fund |
-3%
|
-15%
|
|
|
ACWI
|
iShares MSCI All-World ACWI Index |
-4%
|
-13%
|
|
|
EFA
|
iShares MSCI EAFE Index |
-3%
|
-14%
|
|
|
DIA
|
SPDR Dow Jones Industrial Average |
-4%
|
-9%
|
|
|
SPY
|
SPDR S&P 500 Index |
-4%
|
-10%
|
|
|
GLD
|
SPDR Gold Shares |
-4%
|
2%
|
|
|
VEU
|
Vanguard FTSE All-World ex-US |
-4%
|
-14%
|
|
|
MDY
|
S&P MidCap 400 SPDRs |
-5%
|
-12%
|
|
|
IWM
|
iShares Russell 2000 Index Fund |
-6%
|
-12%
|
|
|
DBC
|
PowerShares DB Commodity Index |
-5%
|
-12%
|
|
|
AAXJ
|
iShares MSCI Asia ex-Japan |
-5%
|
-12%
|
|
|
EEM
|
iShares MSCI Emerging Markets |
-5%
|
-13%
|
|
|
ILF
|
iShares S&P Latin America |
-6%
|
-15%
|
|
|
EPP
|
iShares MSCI Pacific ex-Japan |
-7%
|
-17%
|
Sectors – ETFs
|
Symbol
|
Symbol
|
ETF
|
1-Week
|
4-Weeks
|
|
|
XLP
|
U.S. Consumer Staples Sector SPDR |
-2%
|
-5%
|
|
|
IYZ
|
iShares Dow Jones Telecomm |
-3%
|
-7%
|
|
|
XRT
|
Retail Industry SPDR |
-3%
|
-8%
|
|
|
IGV
|
S&P Software Industry Index |
-5%
|
-11%
|
|
|
SMH
|
Semiconductor HOLDRs |
-2%
|
-11%
|
|
|
XLY
|
U.S. Consumer Discret Sector SPDR |
-4%
|
-11%
|
|
|
XLK
|
U.S. Technology Sector SPDR |
-4%
|
-11%
|
|
|
XLU
|
U.S. Utilities Sector SPDR |
-4%
|
-7%
|
|
|
FDN
|
First Trust DJ Internet Index |
-4%
|
11%
|
|
|
KCE
|
SPDR KBW Capital Markets |
-4%
|
-12%
|
|
|
XLV
|
U.S. Health Care Sector SPDR |
-4%
|
-8%
|
|
|
PPH
|
Pharmaceutical HOLDRs |
-4%
|
-8%
|
|
|
XLB
|
U.S. Materials Sector SPDR |
-4%
|
-13%
|
|
|
PPA
|
PowerShares Aerospace & Defense |
-5%
|
-12%
|
|
|
IHI
|
DJ U.S. Medical Devices |
-5%
|
-8%
|
|
|
IGN
|
iShares S&P U.S. Tech-Networking ETF |
-5%
|
-11%
|
|
|
IBB
|
iShares Nasdaq Biotechnology Index |
-5%
|
-11%
|
|
|
XLF
|
U.S. Financial Sector SPDR |
-4%
|
-12%
|
|
|
IYT
|
iShares Dow Jones Transports |
-6%
|
-10%
|
|
|
XLI
|
U.S. Industrials Sector SPDR |
-6%
|
-11%
|
|
|
KIE
|
SPDR KBW Insurance |
-5%
|
-15%
|
|
|
XLE
|
U.S. Energy Sector SPDR |
-6%
|
-15%
|
|
|
KRE
|
KBW Regional Bank Industry SPDR |
-7%
|
-15%
|
|
|
IGE
|
iShares S&P N. Amer Nat. Resources |
-6%
|
-14%
|
|
|
KBE
|
KBW Bank Industry Index SPDR |
-6%
|
-13%
|
|
|
XHB
|
S&P Homebuilders SPDR |
-7%
|
-15%
|
|
|
OIH
|
Oil Services HOLDR |
-7%
|
-23%
|
|
|
XME
|
S&P Metals & Mining SPDR |
-10%
|
-18%
|
Four-Week Volume Trend
|
Bias
|
Index
|
Major Accumultion
|
Minor Accumulation
|
Major Distribution
|
Minor Distribution
|
|
|
Dow
|
1
|
0
|
8
|
0
|
|
|
S&P 500
|
1
|
0
|
8
|
0
|
|
|
Nasdaq
|
1
|
0
|
7
|
0
|
|
|
Russell2000
|
1
|
1
|
6
|
1
|
| Accumulation: index up with more volume than previous day. Distribution: index down with more volume than previous day. Major: > 60-day average, Minor: <. | |||||
News To Watch This Week
Earnings:
- MONDAY – Campbell Soup (CPB), Guess (GES)
- TUESDAY – Autozone Inc. (AZO), DSW Inc. (DSW), Stanley, Inc.
- WEDNESDAY –American Eagle Outfitters Inc (AEO), Dress Barn (DBRN)
- THURSDAY – Costco Wholesale Corporation (COST), H.J. Heinz Company (HNZ), J. Crew Group, Inc. (JCG), Tiffany & Co. (TIF)
- FRIDAY – Quality Systems (QSII)
Economic:
- MONDAY – Existing Home Sales
- TUESDAY – -Shiller 20-city Index, Consumer Confidence
- WEDNESDAY – Durable Orders, New Home Sales, Crude Inventories
- THURSDAY – Initial Claims , Continuing Claims, GDP – Second Estimate, GDP Deflator – Second Estimate
- FRIDAY – Personal Income, Personal Spending, PCE Prices – Core, Chicago PMI, U. Michigan Consumer Sentiment
Word On The Street
– “It always sounds more than a bit stupid and alarmist to predict a crash, but I did it in 2007 and nailed it. I am going to it again now. Raoul Paul, The Global Macro Investor newsletter.
– “The world should be discussing deflation, not inflation. The world should be discussing buying 30-yr. government bonds, not continually wondering like a stuck record where the first rate hike will appear. RBS’s European Rates Strategy team on what it calls Great Depression II.
– “We are in uncharted waters on account of several issues, including what is going on in Europe and other important structural regime changes. In economic terms, European developments are unambiguously bad for global growth.” Mohamed El-Erian, co-chief investment officer of PIMCO.
This Week’s Word On Discipline
“We are what we repeatedly do. Excellence, then, is not an act, but a habit.” – Aristotle


