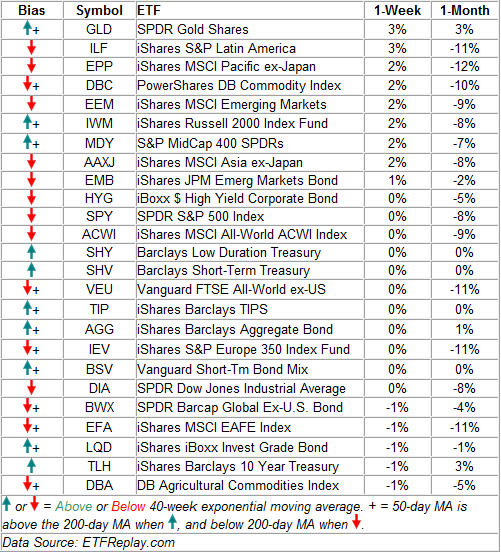
Buyers look up as global panic eases, for the moment.
For a week that saw the major indexes mostly flat, the effect of negative news on the market, such as credit- ratings downgrades of Greece, Portugal and Spain, gives speculators some indication the worst may be priced in.
Sharp rallies from U.S. stocks, after hitting and undercutting key support levels last week, such as the S&P 500 testing its low of the year and the Dow regaining its psychological 10,000 mark after a dip below, coincided with an announcement from China that it wouldn’t dump its European holdings. Whether it was the levels or the announcement that triggered the surge is for you to decide.
After the Dow put in its worst May in 70 years, down 7.92%, where we go from here depends largely on how much selling pressure remains.
Bullish hammer bars on the weekly charts of the majority of stock sectors gives the market an encouraging near-term look. (See Technically Speaking below.) If the stage is set for rally, we’ll need the commitment of institutions for anything enduring to take place.
Until we get confirmation through volume that institutional buyers are willing to load up at these prices, we’re sticking to our Sell Bias. The multiple Distribution Days that turned us into bears several weeks ago will need to be countered by a Follow Through Day (FTD) to signal a reversal.
The longstanding FTD indicator, made popular by William O’Neal of Investors Business Daily, calls for at least one of the major indexes rallying at least 1.7% on volume greater than the day before. This signal has accompanied every major bull leg. But not every FTD has led to a new bull run.
Any bounce without an FTD would would likely lead to another selling opportunity. The scenario might look something like this:
Odds of the market hitting new lows this year weigh heavy with statistics-backed research, such as John Hussman’s Aunt Minnies, that suggest a bigger market correction is in the works. The scenario fits well with the a monthly Dow chart going back 15 years, where another bearish head-and-shoulder pattern looms.
Investors Intelligence’s Bull/Bear ratio of 1.35 has also tilted to the Bears, and would have further to drop to hit its traditional extremes of below .80, where capitulation would likely take place.
The landscape for our beloved Growth Stocks, which serve as indicators themselves, also confirms the bigger bearish picture with low numbers of quality stocks setting up in technical bases and breaking out. While we do have some encouraging names to follow, it’s pretty much a tight market.
Dan,
thegrowthstockreport.com
Technically Speaking
|
Market Bias
|
 |
|
Seller’s Edge
|
Key sectors attempting bounces from support levels bode well for a bounce.

Strong trends are often marked with confirmation from semiconductors (SMH), retail (XRT), financials (XLF) and transportation (IYT), which all possess similar chart characteristics this week.
 Last weeks breakdown through key support for broker dealers (IAI) looks as if the signal was canceled by the rally.

Major Indexes – ETFs
Sectors – ETFs
Four-Week Volume Trend
News To Watch This Week
Earnings:
- MONDAY – Memorial Day
- TUESDAY – none
- WEDNESDAY – Hovnanian Enterprises, Inc. (HOV), Shoe Carnival (SCVL)
- THURSDAY – America’s Car-Mart, Inc. (CRMT), Joy Global Inc. (JOYG), Quiksilver (ZQK), Ulta Salon, Cosmetics & Fragrance, Inc. (ULTA), Wimm-Bill-Dann Foods OJSC (WBD)
- FRIDAY – China Medical Technologies, Inc. (CMED)
Economic:
- MONDAY – Memorial Day
- TUESDAY – Construction Spending, ISM Index
- WEDNESDAY – Pending Home Sales, Crude Inventories, Auto Sales, Truck Sales
- THURSDAY – ADP Employment Change, Productivity-Rev., Unit Labor Costs, Initial Claims, Continuing Claims, Factory Orders, ISM Services
- FRIDAY – Nonfarm Payrolls, Unemployment Rate, Hourly Earnings, Average Workweek
The Word On The Street
- “I think they’re going to stabilize in this general area, and then we’re going to have a significant move to the upside,” Barton Biggs, who runs New York-based hedge fund Traxis Partners LP and whose flagship fund returned three times the industry average last year, said in a Bloomberg Television interview.
- In past intraday Crashes (a la 5/6’s “Flash Crash”) markets stabilize average 30 days later. It has been 21 days since the intraday decline of 9%. Since 1900, in the 6 prior instances of 9%-plus intraday crashes, markets tend to bottom by day 32. J.P. Morgan stock analyst Thomas Lee. WSJ.
- “The best place to have your money is in either sound currencies or real assets. For my money, real assets are a better place to be because, throughout history, when governments have started printing a lot of money, the money has gone into real things – whether that’s silver, or cotton, or natural gas – something that’s real that people can use. Putting into paper money at a time when paper money is being debased all over the world is usually not a good thing to do.” Jim Rogers.


