Menu
The Growth Stock Report

Primary Menu

Skip to content
  • About
    • Contact
    • Disclaimer
  • Research
    • Market Bias Flag
    • Stock Labels
    • Sector Trends
  • Market Metrics
    • Industry Groups
    • Hit List
Show Header Sidebar Content

The Growth Stock Report

strategy, money management, discipline

Month: November 2013

Major Markers

Posted onNovember 26, 2013November 26, 2013AuthorGSRTrades

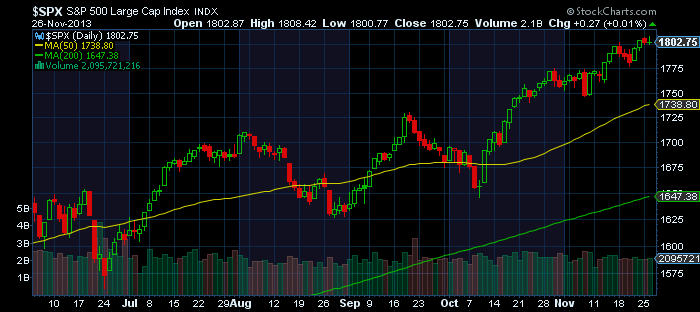
It’s been 13 years since the Nasdaq traded at 4,000. Not coincidentally, lots of bubble talk is brewing. The market can remain irrational longer than you can remain solvent, once said John Maynard Keynes.   Read More …

CategoriesThe Breakdown

Raise Up

Posted onNovember 18, 2013AuthorGSRTrades

This market has had a multitude of reasons to sell, but hasn’t. Don’t fight the tape. It’s hard to call a top now that the S&P is trending comfortably above its congestion zone where symmetry Read More …

CategoriesThe Breakdown

Backwards, Forwards

Posted onNovember 18, 2013AuthorGSRTrades

Here we have a collection of companies with 5-year past sales growth of 30% or more and 5-year projected EPS growth of 30% or more. We added a qualifier of positive ROE to weed out Read More …

CategoriesGrowth Stocks

Victories And Bitch Slaps

Posted onNovember 13, 2013November 13, 2013AuthorGSRTrades

New highs for the major indexes serve just as much as victories to Bulls as they do bitch slaps to bears.  Odds are a good number of aggressive funds and traders are sitting on short Read More …

CategoriesThe Breakdown

Bam 3D Pow!

Posted onNovember 12, 2013AuthorGSRTrades

Following up on our post in August, the breakout on 3D Systems Corp. (DDD) thrives as it nears climax like trajectory.  Conservative money management takes a profit with half a position at 20% and lets Read More …

CategoriesBreakout Watch

Honking Validation

Posted onNovember 7, 2013November 7, 2013AuthorGSRTrades

Thursday’s rush to the exits by institutions backs up our short-term call for a pullback.  Watch and wait. Punctuation marks like these at the end of bull legs can last anywhere from a day to Read More …

CategoriesThe Breakdown

High Expectations

Posted onNovember 6, 2013AuthorGSRTrades

This week we’re looking at growth potential as we’ve narrowed the field down to only those companies with projected EPS growth of at least 30%. We narrowed the list further by screening for a minimum Read More …
CategoriesGrowth Stocks

Holding On

Posted onNovember 4, 2013November 7, 2013AuthorGSRTrades

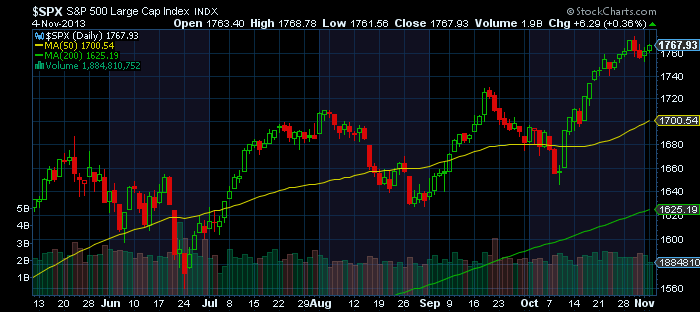
Our bias remains at Buyer’s Caution, as it has all year. However, we’ve noted several reasons to expect the market is primed for another short-term pullback/correction. Increased volume with modest price advancement and an outright Read More …

CategoriesThe Breakdown

Archives

Market Bias

Caution
Caution
Nasdaq above its 50- and 200-day averages; S&P has 7 distribution days.
As of market close: 10/09/26
(updated 10/10/26 10:14 PM ET)
How the flag works

20-Day Accumulation Distribution Score

  Clear A/D (Days)
SPX 0/7
COMPQ 1/3
Volume: NYSE (SPX), QQQ (COMPQ) (why?)
As of market close: 10/09/26
(updated 10/10/26 3:57 PM ET)

Sector Trends

TickerETFBias
IGViShares Expanded Tech-Software+
QTECFirst Trust NASDAQ-100-Tech Sector ETF+
XLKTechnology Select Sector SPDR ETF+
SMHVanEck Semiconductor ETF+
XLEEnergy Select Sector SPDR ETF+
IBBiShares Biotechnology ETF+
FDNFirst Trust Dow Jones Internet ETF+
XLVHealth Care Select Sector SPDR ETF+
IGEiShares North American Natural Resources+
IYZiShares US Telecommunications
PPHVanEck Pharmaceutical ETF
XLFFinancial Select Sector SPDR ETF
KIESPDR S&P Insurance ETF
KCESPDR S&P Capital Markets ETF
XLPConsumer Staples Select Sector SPDR ETF
OIHVanEck Oil Services ETF
IYTiShares Transportation Average
XRTSPDR S&P Retail ETF
XLIIndustrial Select Sector SPDR ETF
KRESPDR S&P Regional Banking ETF
XLBMaterials Select Sector SPDR ETF
KBESPDR S&P Bank ETF
XLYConsumer Discret Sel Sect SPDR ETF
IHIiShares US Medical Devices
XLUUtilities Select Sector SPDR ETF
XMESPDR S&P Metals and Mining ETF
PPAInvesco Aerospace & Defense ETF
XHBSPDR S&P Homebuilders ETF
+ = Sector above 50-day and 200-day SMA's.
= Sector above 200-day SMA, below 50-day SMA.
+ = Sector above 50-day SMA, below 200-day SMA (improving).
= Sector below 200-day and 50-day SMA's.
As of market close: 10/09/26
Updated 10/10/26 at 4:24 PM ET
How to read this table

Categories

  • Archives
  • Breakout Watch
  • Chart Watch
  • Growth Stocks
  • Hit List
  • Market Bias
  • Positions Update
  • Research
  • Shorts
  • Story Stocks
  • The Breakdown
  • The Growth Stock Report

Archives

Archives

  • October 2026
  • May 2020
  • April 2020
  • March 2017
  • February 2017
  • October 2016
  • September 2016
  • August 2016
  • July 2016
  • June 2016
  • May 2016
  • April 2016
  • March 2016
  • February 2016
  • January 2016
  • November 2015
  • October 2015
  • September 2015
  • August 2015
  • July 2015
  • June 2015
  • May 2015
  • April 2015
  • March 2015
  • February 2015
  • January 2015
  • December 2014
  • November 2014
  • October 2014
  • September 2014
  • August 2014
  • July 2014
  • June 2014
  • May 2014
  • April 2014
  • March 2014
  • February 2014
  • January 2014
  • December 2013
  • November 2013
  • October 2013
  • September 2013
  • August 2013
  • July 2013
  • June 2013
  • May 2013
  • April 2013
  • March 2013
  • February 2013
  • January 2013
  • December 2012
  • November 2012
  • October 2012
  • September 2012
  • July 2012
  • June 2012
  • April 2012
  • March 2012
  • February 2012
  • January 2012
  • October 2011
  • September 2011
  • August 2011
  • July 2011
  • June 2011
  • October 2010
  • September 2010
  • August 2010
  • July 2010
  • June 2010
  • May 2010
  • April 2010
  • March 2010
  • February 2010
  • January 2010
  • November 2009
  • October 2009
  • September 2009
  • August 2009
  • July 2009
  • June 2009
  • May 2009
  • April 2009
  • March 2009
  • February 2009
  • January 2009
  • December 2008
  • November 2008
  • October 2008
  • September 2008
  • August 2008
  • July 2008
  • June 2008
  • May 2008
  • April 2008
  • March 2008
  • February 2008
  • January 2008
  • December 2007
  • November 2007
  • October 2007
  • September 2007
  • August 2007
  • July 2007
  • June 2007
  • May 2007
  • April 2007
  • March 2007
  • February 2007
  • January 2007
  • December 2006
  • November 2006
  • October 2006
  • September 2006
  • August 2006
  • July 2006
  • June 2006
  • May 2006
  • April 2006
  • March 2006
  • February 2006
  • January 2006
  • December 2005
  • November 2005
  • October 2005
  • September 2005
  • August 2005
  • July 2005
  • June 2005
  • May 2005
  • April 2005
  • March 2005
  • February 2005
  • January 2005
Copyright © 2026 The Growth Stock Report. All Rights Reserved.
Clean Box by Catch Themes
Scroll Up
  • About
    • Contact
    • Disclaimer
  • Research
    • Market Bias Flag
    • Stock Labels
    • Sector Trends
  • Market Metrics
    • Industry Groups
    • Hit List